

80503 Market Updates
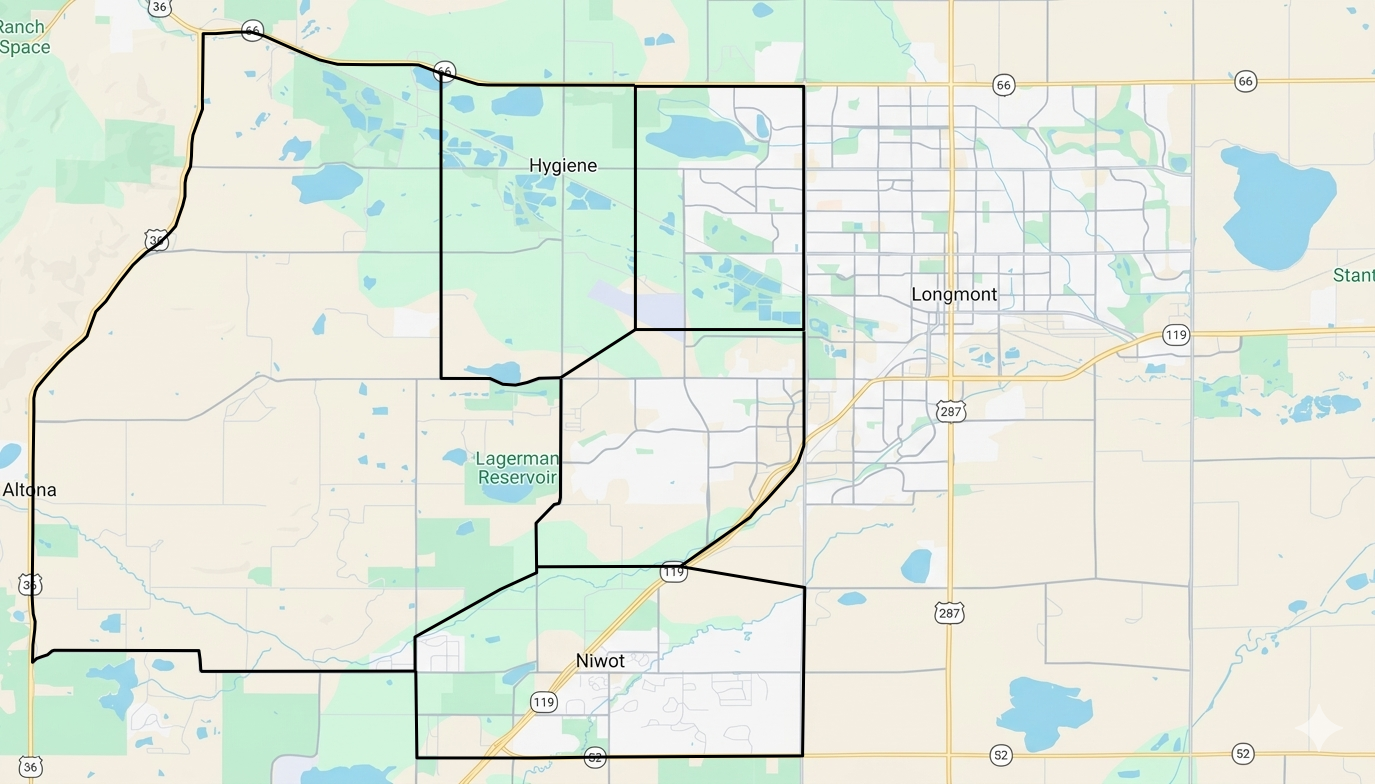
INTERACTIVE NEIGHBORHOOD MAP
Click an area below to explore specific neighborhood data.
The 2025 Real Estate Market Overview
Why Are Some Homes Selling Quickly and Other’s Sitting? Where is the 80503 Real Estate Market Heading in 2026?
Overview The main factor affecting single family home sales nation wide is affordability. Though home prices have been generally stable, they have become dramatically less affordable since 2022 for Buyers who are purchasing with a loan. The main reason that homes have become less affordable is due to the impact of higher interest rates. Additionally, affordability has been negatively impacted by raising property taxes and insurance premiums. Colorado has seen the largest growth in insurance premiums in the country according to the National Bureau of Economic Research.
Prices have remained steady, because Boulder County is a growth constrained market. However, the sales price doesn’t tell the entire story about what the Seller is actually putting in their pocket. In 2025 our research shows, that the Seller’s consistently contributed concessions (Seller Credits) to Buyers. The 50th percentile contribution was $6,202 dollars, while the 75th percentile was $12,000.
What’s Selling?
- Homes in the first group tended to have the least amount of concessions. These Sellers were also more likely to get 100% of asking price, or very close.
- Homes in the second group typically sold for 5% less thank asking price AND granted the largest concessions. For these Seller’s the median concession was $11,460.
- Homes priced above $600 per square foot were the top 10% of homes sold in 80503. The typical profile for this home was: 2.24M List Price and 4,410 Square Feet. These Sellers granted less concessions because the Buyers tend to have smaller mortgages and are less interest rate sensitive. About half of these homes sold in less than 100 days.
Implications for 2026 Sellers in 2025 should above all strive to price their home such that it goes under contract in under 100 days.
Months of supply has been gradually increasing since 2022. For most of 2025 there was about 3-4 month’s of supply. This means that on average it would take Sellers 3-4 months to go under contract if no new inventory became available and the home was priced correctly. The best time for Sellers to list their home was February. The next best months were March, then April, followed by May. The worst preforming Sellers sold in July. Sellers that need to buy a replacement property should consider listing in February, or March, if possible. This will allow them to take advantage of the best months of the year in terms of selling performance. If it takes 60 days to go under contract, and 30 days to close, then one will be positioned to purchase near July when inventory is highest and Buyers have the most negotiating strength. While this study focused on which single family homes sold in 80503, one should take note that over 200 singe-family homes expired or were withdrawn from the market in 2025. These Sellers may return to the market. This would increase the months of supply, and weaken Seller positioning. This risk is another incentive for Seller’s to list early. A second threat to the market is interest rates. While rates are slowly trending lower, if the trend terminates or reverses Buyers may put off home purchases for yet another year. Again, it’s better to list early while a pool of Buyers are optimistic about the direction of rates.